




Investment Strategy : Dynamic
OBJECTIVES:
The Dynamic Investment Strategy has the highest risk of our managed portfolio range. It has specifically been designed for clients who specify either a Medium or Higher Risk mandate and who seek capital growth from their portfolio.
The portfolio will typically hold no more than 20% in lower risk investments and is unlikely to hold more than 15% in higher risk investments The portfolio is benchmarked against the MSCI PIMFA Private Investor Growth Index.
PERFORMANCE:
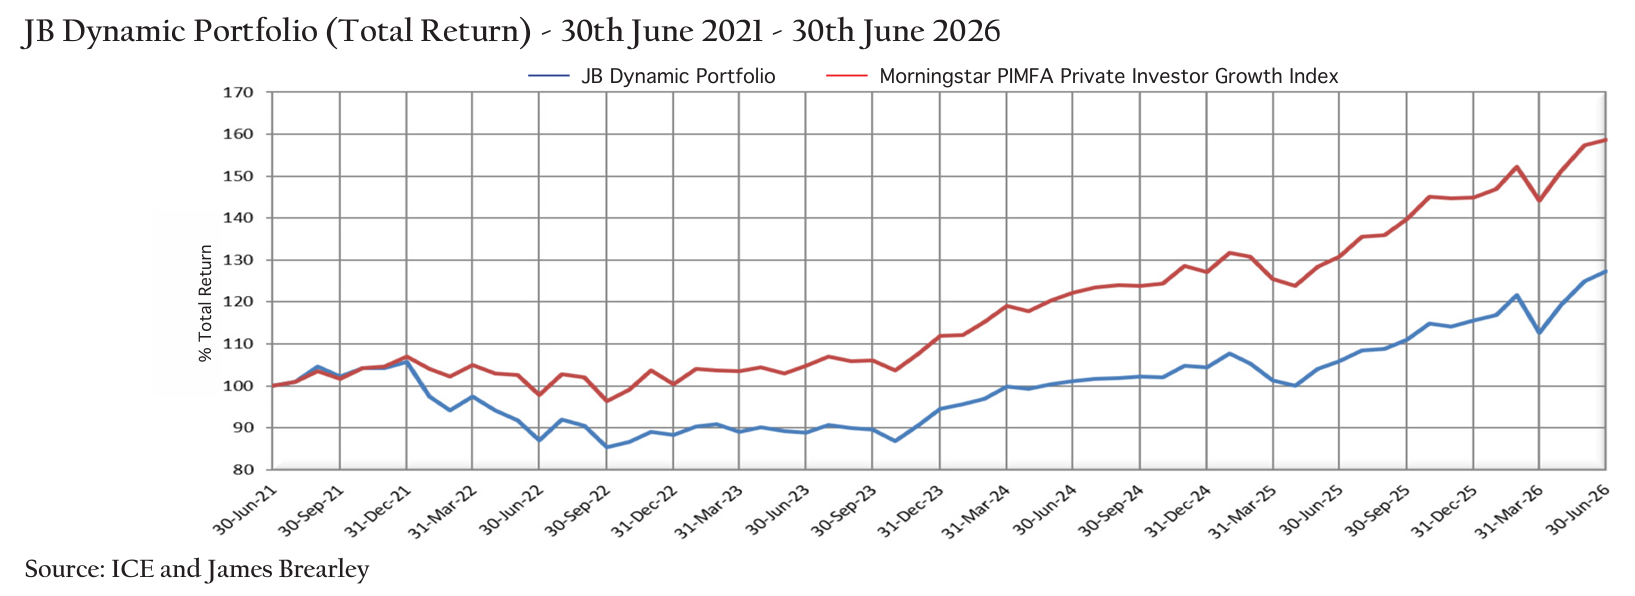
Cumulative Total Return Performance
| INDEX | 1y Total Return % |
3y Total Return % |
5y Total Return % |
10y Total Return % |
|---|---|---|---|---|
| JB Dynamic Portfolio* | 20.13 | 43.18 | 27.25 | 111.90 |
| Morningstar PIMFA Private Investor Growth Index |
21.33 | 51.41 | 58.63 | 144.23 |
| Cboe UK All Companies Index | 21.41 | 52.80 | 69.08 | 129.83 |
| MSCI AC World ex UK Index | 26.42 | 62.01 | 75.12 | 244.89 |
Discrete 1 Year Total Returns Performance
| INDEX | Jun 2026 Total Return % |
Jun 2025 Total Return % |
Jun 2024 Total Return % |
Jun 2023 Total Return % |
Jun 2022 Total Return % |
|---|---|---|---|---|---|
| JB Dynamic Portfolio* | 20.13 | 4.80 | 13.74 | 2.14 | -12.99 |
| Morningstar PIMFA Private Investor Growth Index |
21.33 | 7.50 | 15.97 | 7.13 | -2.58 |
| Cboe UK All Companies Index | 21.41 | 11.61 | 12.76 | 8.30 | 2.18 |
| MSCI AC World Ex UK Index | 26.42 | 7.04 | 19.85 | 11.44 | -4.66 |
Source: FE Analytics and ICE. All performance figures shown are Total Return. As at 30th June 2026.
*Source: James Brearley
Total return performance has been calculated by adding in the projected income from the other positions being re-invested on a quarterly basis as part of a general re-balance exercise. Total return performance has been calculated up until December 2015 by assuming the receipt of a quarter of the projected income every 3 months with this being reinvested into two model positions at half yearly intervals.
Any performance information shown represents model portfolios which are periodically restructured and/or rebalanced. Although the model portfolios are representative of a client’s individual portfolio, the actual returns may vary from the model portfolio returns shown. In addition, model portfolio performance quoted does not take into consideration the cost of investing and /or management fees. The returns achieved by a client may be lower than the returns shown above. Although the model portfolios are representative of a client’s individual portfolio the asset allocation of and the investments held in a client’s individual portfolio may differ..
Asset Allocation Summary (30/06/2026)
Overall Risk Summary (30/06/2026)
CURRENT PORTFOLIO: TOP 10 LARGEST HOLDINGS
| Top 10 Largest Holdings | Weighting % |
|---|---|
| Vanguard Funds PLC S&P 500 UCITS ETF | 9 |
| Pinnacle Life Cycle Global Equity Select | 9 |
| Artemis Global Income | 8.5 |
| Blue Whale Growth | 8.5 |
| Guinness Global Income | 6 |
| Nomura Global Dynamic Bond | 5 |
| Atlantic House Defined Returns Fund -ACC | 5 |
| Artemis UK Select | 5 |
| Ninety One UK Special Situations | 5 |
| First Trust SMID Rising Dividend Achievers UCITS ETF | 5 |
| Total | 66 |
IMPORTANT INFORMATION
Investing in stockmarket based investments may not be right for all investors. You should consider carefully and/or seek professional guidance before investing. Please remember that past performance should not be seen as a guide to future performance. The value of an investment and any income from it can fall as well as rise as a result of market and currency movements and you may not get back the amount you originally invested.